NBA Three-Point Shooting as a Betting Variable: How to Use Pace-and-Space Data in Your Analysis
 Available in US

- Three-Point Shooting and Betting: The Variable That Changed the NBA and Still Misprices Markets
- Three-Point Rate vs Three-Point Percentage: Which Numbers Actually Predict Game Results
- Three-Point Defence: The Underrated Side of the Matchup Equation
- High-Variance Game Identification: When Three-Point Shooting Distorts the Spread
- Three-Point Shooting and the UK NBA Betting Calendar: Which Parts of the Season Matter Most
Three-Point Shooting and Betting: The Variable That Changed the NBA and Still Misprices Markets
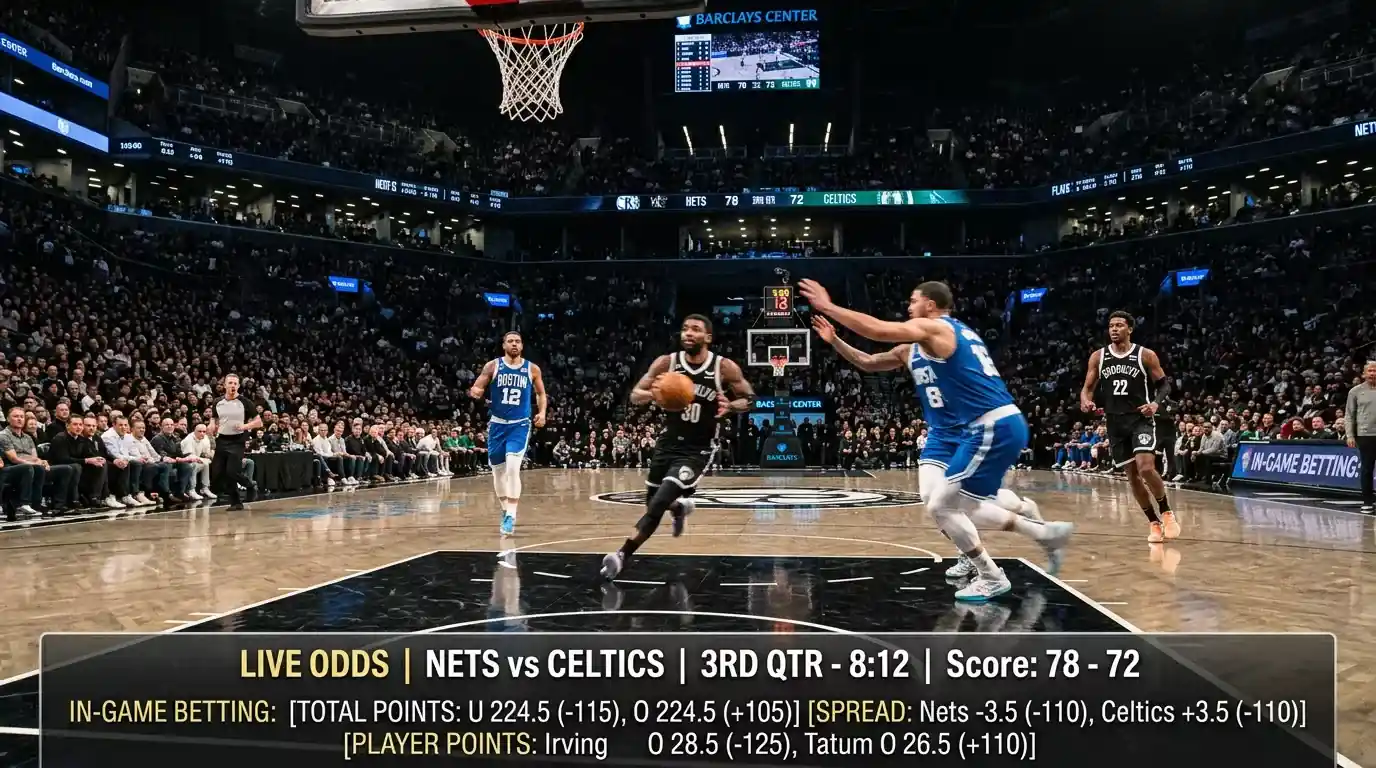
The three-point revolution fundamentally altered what an NBA game produces statistically — and it did so faster than the betting market’s pricing models fully adapted. When the Warriors demonstrated in 2015-16 that a system built around high-volume, high-accuracy three-point shooting could dominate the league, every franchise scrambled to copy the approach. Game totals rose substantially, spread patterns shifted, and prediction models built on pre-2015 data became increasingly unreliable. That era of adjustment created enormous value for bettors who recognised the structural shift early.
The market has since calibrated to the new baseline, but three-point shooting still creates exploitable pricing gaps at the individual matchup level. Not every game is equally affected by the three-point dynamic — it depends on the specific combination of three-point shooting teams and three-point defending defences. Identifying games where the three-point matchup significantly favours one side, and where the spread or total has not fully reflected that advantage, is one of the most analytically tractable edges available in daily NBA betting.
Research across NBA outcome prediction models consistently finds that three-point percentage differential — the difference between a team’s three-point conversion rate and the league average — ranks among the top predictors of game outcomes, alongside pace and net rating. Yet many public bettors and even some analytical frameworks underweight this specific variable in their pre-game models.
Three-Point Rate vs Three-Point Percentage: Which Numbers Actually Predict Game Results
Three-point shooting involves two distinct metrics that are often conflated but have very different predictive properties. Three-point rate is the share of a team’s total field goal attempts that are three-point attempts. Three-point percentage is the conversion rate on those attempts. For betting analysis, these metrics predict different outcomes and should be applied separately.
Three-point rate is more stable game-to-game than percentage. A team that takes 45% of their shots from three will consistently do so across opponents — it reflects their offensive philosophy and personnel, not variance. Three-point percentage is highly variable: a team that converts at 38% over the season will frequently shoot 32% or 45% in any given game purely due to small sample randomness. This volatility is the source of the famous “three-point variance problem” in NBA totals analysis — high-three-point-rate games swing wildly in total points scored depending on conversion luck.
The betting implication: three-point rate is the variable to incorporate into your pre-game projection as a stable structural factor. Three-point percentage for a specific game is a wild card that the model should account for through variance ranges rather than point estimates. A game between two high-rate three-point teams carries higher variance in both spread and totals outcomes than a game between two mid-range teams, and that variance is not always reflected in the bookmaker’s pricing.
Three-Point Defence: The Underrated Side of the Matchup Equation
Three-point offence gets all the analysis. Three-point defence — specifically, how many three-point attempts a team’s defence allows and at what conversion rate — receives far less attention in betting discourse despite being equally predictive of game totals outcomes.
Teams with poor three-point defence allow opponents to generate high-quality three-point looks, either through perimeter rotational lapses, help defence gaps, or explicit schematic vulnerabilities. When a high-rate three-point team faces a poor three-point defending opponent, the structural setup for an elevated scoring game is clear. The reverse matchup — a low-three-point-attempt team facing a three-point-defence-suppressing opponent — creates under-friendly conditions that the bookmaker’s line may not fully price if it is calibrated from average defensive inputs.
Defensive three-point data is available on the same free platforms as offensive data: the NBA’s own statistics site and Basketball Reference both publish opponent three-point attempts allowed and conversion rates for all 30 teams, updated after each game. Checking this data before projecting a game total takes two minutes and adds a layer of matchup precision that a general pace-versus-efficiency model misses entirely.
High-Variance Game Identification: When Three-Point Shooting Distorts the Spread
Beyond totals, three-point shooting affects spread betting in a specific and exploitable way. Games between high-rate three-point teams produce higher spread variance than the bookmaker’s line-setting process implicitly assumes. A spread set at -5.5 on a favourite in a low-pace, low-three-point matchup carries very different variance characteristics from the same spread in a high-pace, high-three-point game. The same -5.5 means different things in different shooting environments.
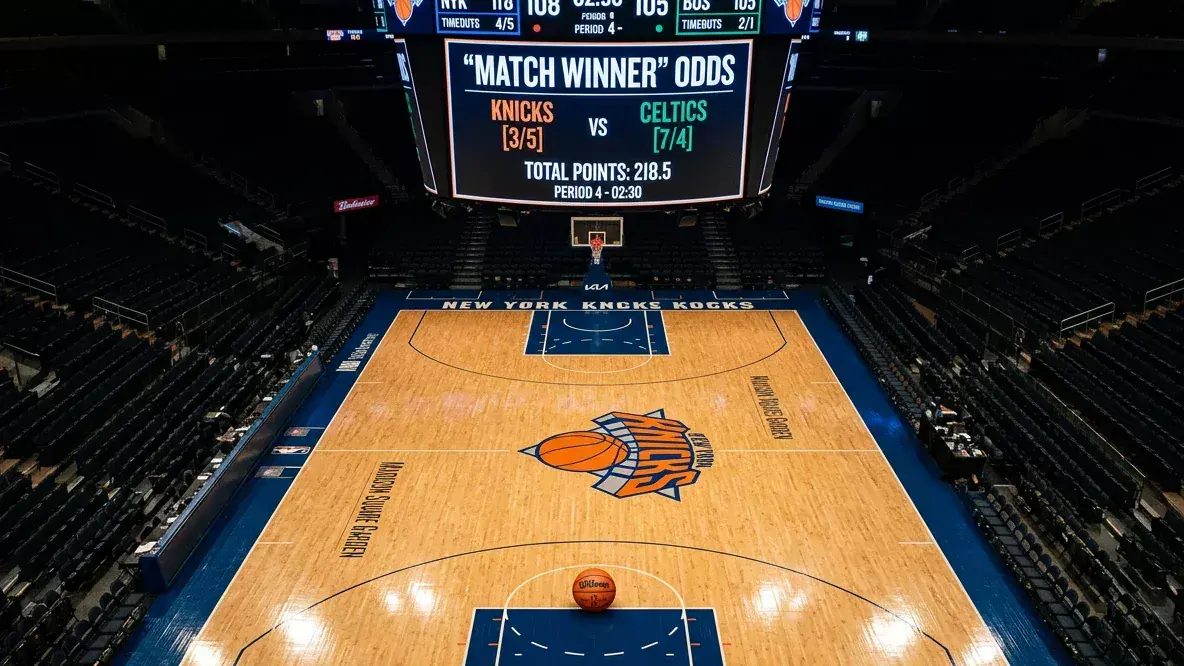
High-three-point-rate games are structurally more likely to produce either blowouts or surprise upsets than the spread implies, because conversion variance can swing 15-20 points in final score differential when both teams are launching 35+ threes per game. A spread of -5.5 in a typical low-variance game implies roughly a 60% probability of the favourite covering. The same spread in a high-three-point-rate game, given the elevated variance, implies a closer to 55% probability. That 5% gap is genuine value on the underdog in high-variance three-point matchups — value that the bookmaker has not explicitly built into the spread.
Identifying these high-variance matchups before the game, then positioning on the underdog at a spread that does not fully adjust for the elevated variance, is a sophisticated application of three-point shooting data that goes beyond the standard pace-and-efficiency framework. The key is not predicting who will shoot well on a given night — that is unpredictable — but identifying games where the structural conditions make the spread’s implied probabilities slightly incorrect due to unaccounted variance. The foundational EV methodology that makes this variance-aware approach most rigorous is detailed in our guide on NBA spread betting for UK bettors.
Three-Point Shooting and the UK NBA Betting Calendar: Which Parts of the Season Matter Most
Three-point shooting varies predictably across the season, and that variation has direct implications for how much weight to give three-point data in your betting models at different times of the year. Early season (October to November) sees elevated three-point conversion rates for most teams as defences are still in their opening rhythm and shot selection is loose. Mid-season three-point rates stabilise toward team baselines as defensive schemes tighten. Late season and playoffs see conversion rates decline as defences specifically game-plan to suppress shooting zones.
For UK punters building annual betting frameworks, the practical calendar implication is this: in October and November, weight three-point rate data modestly and account for higher conversion variance than usual. From December onwards, current-season three-point data becomes more reliable as a predictor. In the playoffs, apply a general downward adjustment to three-point conversion expectations regardless of team rates, reflecting the heightened defensive preparation that characterises postseason basketball.
The gross gambling yield from UK online betting reached £16.8 billion in 2024/25 per Gambling Commission data, reflecting the scale of the market in which every marginal analytical edge compounds significantly over a season. Building a rigorous three-point matchup filter into your pre-game NBA process is a time investment of minutes per game that produces a consistent, quantifiable improvement to spread and totals projection accuracy — and over the course of an 82-game regular season, consistency is what separates profitable long-run NBA betting from break-even guessing.
How much does three-point shooting variance affect NBA totals outcomes?
Three-point shooting is the primary source of scoring variance in modern NBA games. A team attempting 35 threes per game at their season-average conversion rate will produce a scoring range of roughly plus or minus 15-20 points from their expected output on any given night, depending on whether they convert at 28% or 42% from three. This variance is larger than any other single statistical input, which is why high-three-point-rate games have wider scoring outcome distributions and why pre-game totals in these matchups should be treated as ranges rather than point estimates.
Should I weight recent three-point shooting percentage more than season average for prop bets?
For game totals projections, recent three-point percentage is less reliable than season average due to its inherent volatility — it resets toward the mean over large samples regardless of short-term runs. For player props specifically tied to three-point makes, a rolling 10-game average of three-point attempts (not percentage, which is too volatile) combined with the specific defensive matchup quality is more predictive than either full-season average or recent percentage. Attempts rate is stable; conversion is variable; use attempts with matchup context.
Prepared by the nba Bets of the day editorial staff.