NBA Player Props and Usage Rate: Why Minutes Alone Never Tell the Whole Story
 Available in US
Usage Rate in NBA Betting: The Stat That Explains Why Two Players With Equal Minutes Score Very Differently
Early in my NBA betting career, I made a persistent mistake: treating minutes as the primary predictor of player scoring output. Two players with 28 minutes each should produce similar stat lines, right? Wrong — spectacularly wrong, as I discovered after too many losing player prop bets. The missing variable was usage rate, and once I understood it, my approach to every NBA player prop changed fundamentally.
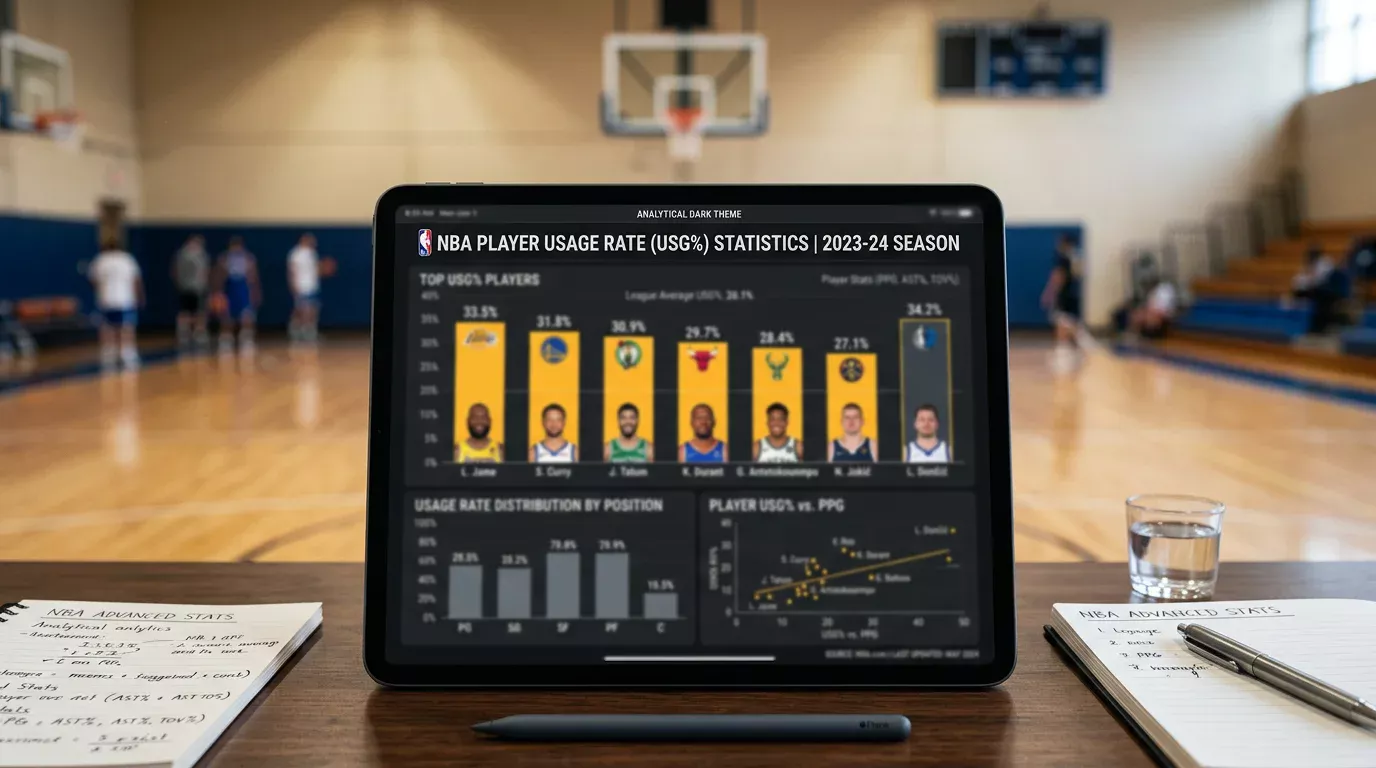
Usage rate, expressed as a percentage, estimates what share of a team’s total possessions end with a specific player’s shot attempt, free throw, or turnover. A player with 35% usage is involved in more than a third of everything their team does offensively when they are on the floor. A player with 12% usage is essentially a complementary piece who scores when open opportunities arise but rarely creates their own shots. Same minutes, completely different expected output — and completely different prop line implications.
The NBA’s UK audience growth — with basketball now ranking sixth in sports engagement among adults aged 18-24, per the 2026 EY-Parthenon Sports Engagement Index — has expanded the prop market significantly. More players, more markets, more lines. Most of those lines are priced adequately at the team star level but become progressively less precise as you move down the usage hierarchy. That imprecision is where the edge lives.
How Usage Rate Interacts With Minutes to Produce Expected Prop Lines
The practical relationship between usage rate, minutes, and expected scoring is multiplicative. A player with 30% usage in 32 minutes will attempt more shots and get to the free throw line more often than a player with 18% usage in 35 minutes. The higher-usage player’s total offensive involvement produces higher scoring output despite playing slightly fewer minutes.
Converting usage rate into a scoring projection requires one more step: efficiency. Usage rate tells you how often a player ends possessions; true shooting percentage tells you how efficiently they convert those possessions into points. A player with 30% usage and excellent efficiency (60%+ true shooting) will score more than a player with the same usage and mediocre efficiency (53%). The combination of usage rate and true shooting percentage produces a reliable expected points baseline that you can compare against the bookmaker’s prop line.
This framework is most powerful in two specific situations: when a key player is absent due to injury, redistributing usage to teammates, and when a player’s role has recently changed within their team’s offensive structure. Both situations create temporary prop line mispricings that persist for three to seven games before the market fully adjusts.
Absence-Driven Usage Spikes: The Most Reliable Source of Prop Market Edge
When a primary ball-handler or high-usage scorer is ruled out, their offensive possessions are redistributed among the remaining roster. This redistribution is not uniform — it clusters around the next highest-usage players in the rotation. A 28%-usage player whose team loses their 32%-usage lead scorer will absorb a disproportionate share of the vacated possessions, potentially reaching 35-38% usage for the game.
The prop market’s lag in responding to this dynamic is systematic and consistent. When a star player is ruled out, the obvious beneficiary — the second scorer, often already well-known — sees their prop line adjust quickly. The less obvious beneficiaries — the third and fourth options whose minutes and usage also increase as the coach restructures the attack — see their lines adjust more slowly, sometimes not fully until game time or beyond.
I have found that players ranked third and fourth in a team’s offensive hierarchy see the most significant prop value creation after a star absence. Their baseline lines are set from rotation-normal usage rates; the actual game plays out with elevated usage that the line has not fully priced. A player whose line sits at 12.5 points but will likely see 22-25% usage rather than their normal 16% is a structural over candidate that the market is undervaluing.
Usage Volatility and the Problem of Small Samples
Usage rate is more volatile than most per-game statistics, and this volatility creates both opportunity and risk in prop betting. A player’s usage rate can swing by 5-8 percentage points from game to game based on opponent defensive scheme, game script, and coaching decisions. A player who averages 24% usage might see games ranging from 17% to 32% within the same week.
This volatility means that season-average usage rates are less useful for individual game prop projection than rolling 10-game averages. A player who has seen elevated usage in recent games due to a teammate’s injury deserves a different prop baseline than their season-average usage suggests. Conversely, a player whose usage has declined over the past ten games due to a new teammate’s arrival — or a coaching scheme change — should be evaluated against their current usage level, not the season average that still reflects higher-usage periods.
The most common bookmaker prop pricing error is anchoring to season-average usage when a structural usage change has occurred. Identifying those structural changes early — through rotation data, coaching interview language, or box score trends — and acting before the market has fully absorbed the new usage reality is the core of usage-based prop value extraction. The broader prop betting framework that combines usage with matchup and defensive positioning analysis is covered in the guide on NBA player props analysis for UK bettors.
What is a good usage rate for an NBA player to have a reliable scoring prop?
A player needs roughly 20% or higher usage to have a reliably predictable scoring prop line. Below 20%, scoring output is too dependent on shot availability and open looks created by teammates’ actions — producing high variance that makes props difficult to bet systematically. Stars with 28-35% usage have the most predictable scoring floors. Secondary scorers with 20-25% usage are the next most reliable category for prop analysis.
How quickly do UK bookmakers adjust player prop lines after a high-usage teammate is ruled out?
Prop line adjustments after a star absence vary by player profile. The immediate beneficiary (second scorer) typically sees their line adjusted within 30-60 minutes of the official absence confirmation. Third and fourth options may take 2-4 hours to be fully adjusted, and on lower-profile games the adjustment may not be complete until game-day. UK punters who identify non-obvious usage beneficiaries and act within the first 60-90 minutes of a star absence news can sometimes capture prop value before the market fully closes the gap.
Published by the nba Bets of the day team.