
NBA Totals Historical Trends: How League-Wide Scoring Changes Affect Your Over/Under Bets
 Available in US
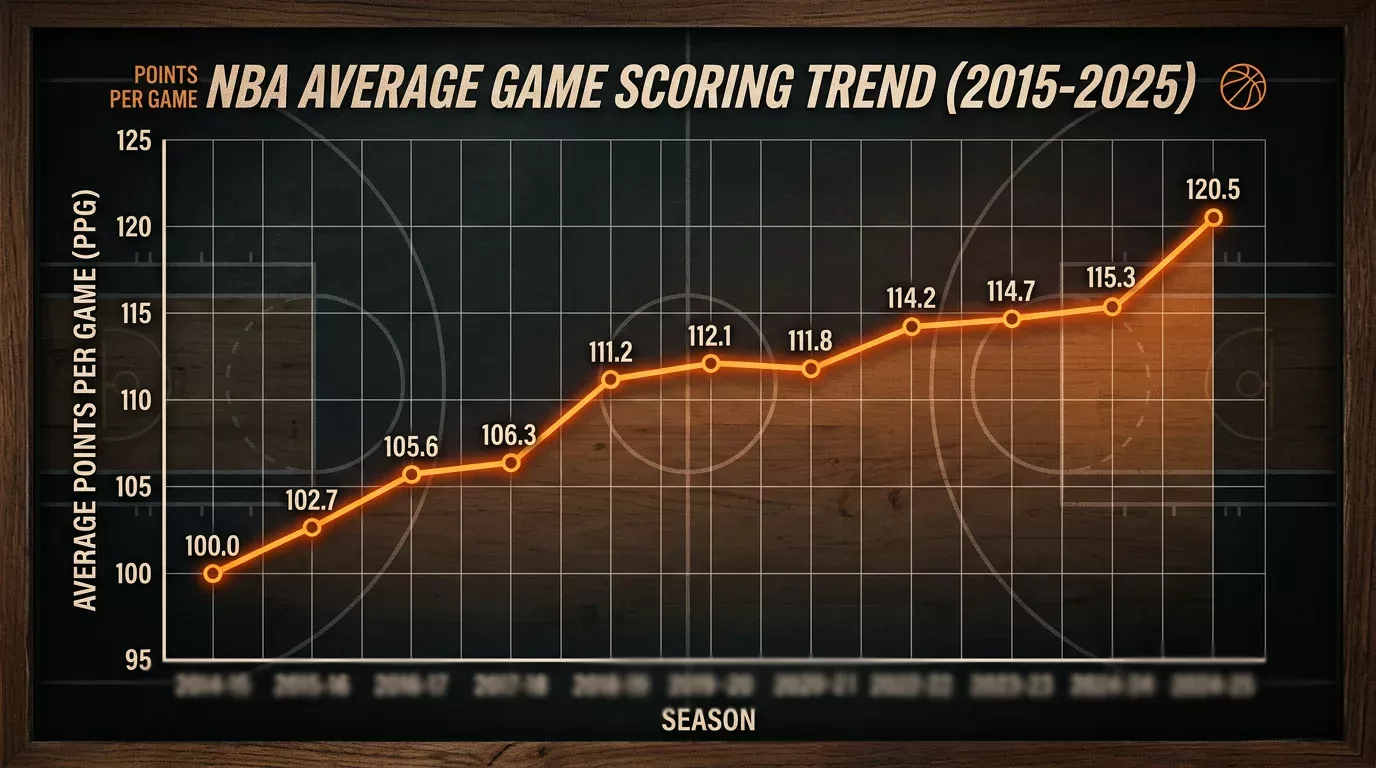
NBA Scoring Trends Over Time: Why the League Average Matters Before Any Totals Bet
There is a version of NBA totals betting that treats each game in isolation — pace versus efficiency for these two teams, referee assignment, rest differential — and reaches a conclusion about the projected score. That process is largely correct, but it misses a contextual layer that has meaningfully affected every totals bet placed in the last decade: the league-wide scoring environment has changed dramatically, and understanding that change is essential for calibrating any totals model correctly.
The era of NBA history we are currently in — often called the “pace and space” era — has pushed scoring averages to levels not seen since the high-flying 1980s. The combination of three-point shooting proliferation, pace acceleration, and rule changes favouring offensive flow has produced a league where the average game total is substantially higher than it was in the mid-2000s defensive-minded era. Any historical data you use in a totals model needs to be adjusted for era if it includes pre-2015 games — otherwise you are mixing apples and oranges.
The Pace Era: How Modern NBA Scoring Changed the Totals Market Post-2015
Something decisive shifted in the NBA around the 2015-16 season. The Golden State Warriors’ three-point revolution — combined with concurrent rule interpretations favouring offensive players and expansion of the “freedom of movement” principles that limited defensive physicality — produced a league-wide scoring surge that bookmakers initially under-priced. Totals bettors who identified the trend early found consistent over value in the mid-2010s as the market calibrated to the new reality.
By 2018-19, the average NBA game combined for over 220 points — a figure that would have looked wildly inflated against the 185-190 game totals of the early 2000s. The market adjusted progressively, and by 2020, the systematic over value from the pace era shift had largely been absorbed. But the transition created a useful lesson: era shifts in NBA scoring happen gradually enough to generate sustained mispricing over 2-3 seasons, and recognising them early is genuinely valuable for totals bettors.
Research into NBA prediction models confirms that offensive efficiency and pace features have become more predictive over time as the game has evolved, consistent with the real-world observation that scoring is now more pace-driven than it was in previous eras. The academic literature on NBA outcome prediction, covering studies from 2019 to 2024, shows that models using pace-adjusted efficiency metrics consistently outperform those relying on raw scoring averages — a finding that is directly applicable to totals betting.
Early Season vs Late Season Totals: When Markets Correct and When They Lag
Within any given season, totals markets pass through a correction cycle that creates identifiable patterns for analytical bettors. The early season (October to November) is the most uncertain period: teams have not yet established stable performance profiles, coaching schemes are still being embedded, and the bookmaker is pricing from a combination of pre-season data and the previous year’s averages.
During this early period, totals markets are most likely to lag behind the actual scoring environment. Teams that have significantly changed their pace — through offseason acquisitions, coaching changes, or deliberate tactical shifts — will have early-season totals set from last year’s data. If a team has demonstrably shifted toward higher-pace basketball, the over will be available at reasonable odds for the first 10-15 games before the market recalibrates.
Late season (February onwards) sees the inverse: markets become more precisely calibrated because there is a full season of current data to price from. The opportunities are smaller but the pricing is more efficient. The best late-season totals value tends to come from identifying specific game contexts — tanking teams playing out the string, resting stars in meaningless games — where the bookmaker’s line is set from season averages that no longer reflect current competitive intent.
Using Team-Level Totals Trends Without Data-Mining Bias
One of the most common analytical errors in NBA totals betting is finding a team with an impressive streak on the over or under and treating that streak as predictive rather than descriptive. A team that has gone over in 14 of their last 20 games is not necessarily a strong over bet going forward — that record is a statistical outcome, and it may simply reflect that the bookmaker has been setting the total slightly low for their matchups during that period, which will correct itself.
The data-mining problem is particularly acute in team trends because the sample sizes are small. 20 games is not enough to distinguish skill from variance in totals outcomes. The appropriate use of team-level trends is to ask: is there a structural reason, visible in the underlying metrics, that explains this streak? If a team’s offensive rating has meaningfully improved and their pace has accelerated, a trend toward the over is explainable and potentially persistent. If the trend is not explainable from metrics, it is likely noise that will revert.
Team-level totals trends are most useful as a corroborating signal rather than a primary one. If your pace and efficiency model projects a total above the bookmaker’s line, and the team has also been trending over consistently with an explainable metric basis, the combination of signals strengthens the case. A totals trend in isolation — “they have gone over in 14 of their last 20” without the underlying metric explanation — is not a reliable betting basis. The full framework for connecting metrics to totals projections is in our guide on NBA over/under betting strategy.
Has the average NBA game total increased significantly over the last decade?
Yes, substantially. The average combined game total in the NBA was in the 185-195 range in the mid-2000s defensive era. By the late 2010s, it had risen to 215-225, and recent seasons have produced averages consistently above 220 points combined. The shift reflects the three-point revolution, pace acceleration, and rule changes favouring offensive flow. This long-term trend is now priced into bookmaker lines, but year-to-year fluctuations and team-level deviations continue to create totals betting opportunities.
How much does the league scoring average change between October and April?
Within a typical season, the league scoring average shifts by 3-6 points combined between October and April. October tends to be slightly higher as defensive schemes are not yet embedded and offences are in rhythm. The scoring average typically dips modestly in the December-January period as defences tighten, then rises again as the pace picks up in the final stretch with teams in playoff positioning mode. The variation is not dramatic but is measurable and worth accounting for when evaluating totals in very early or very late-season games.
Prepared by the nba Bets of the day editorial staff.